This section looks at how we’re working to make our roads safer and more efficient by tackling unnecessary or redundant worksites!
What does “redundant” mean?
-
Redundant worksites are places where Temporary Traffic Management (TTM) is set up, but there’s no risk present. This can cause frustration for road users and lead to inefficiencies.
- On the flip side, there are also unprotected risk sites—places where there’s a risk, but no TTM has been put in place. Both situations are important to address for safety and public trust.
Proactive Redundant TTM Collection Update
Directionz Ltd launched its proactive collection of redundantContinue reading
This section looks at how we’re working to make our roads safer and more efficient by tackling unnecessary or redundant worksites!
What does “redundant” mean?
-
Redundant worksites are places where Temporary Traffic Management (TTM) is set up, but there’s no risk present. This can cause frustration for road users and lead to inefficiencies.
- On the flip side, there are also unprotected risk sites—places where there’s a risk, but no TTM has been put in place. Both situations are important to address for safety and public trust.
Proactive Redundant TTM Collection Update
Directionz Ltd launched its proactive collection of redundant TTM equipment across Auckland in late March. The company is gradually surveying the Auckland network to identify and retrieve obsolete TTM gear. This project is designed to improve both the efficiency and cleanliness of the network.
We are encouraging industry partners to stay engaged and support this initiative. You can play your part by responding to requests to remove the marked gear we find that belongs to your company.
As of 21st October 2025, a total of 15,046 items have been cleared from the network, while 5,477 exceptions have been noted and left in place. Further updates will be shared in the next newsletter.
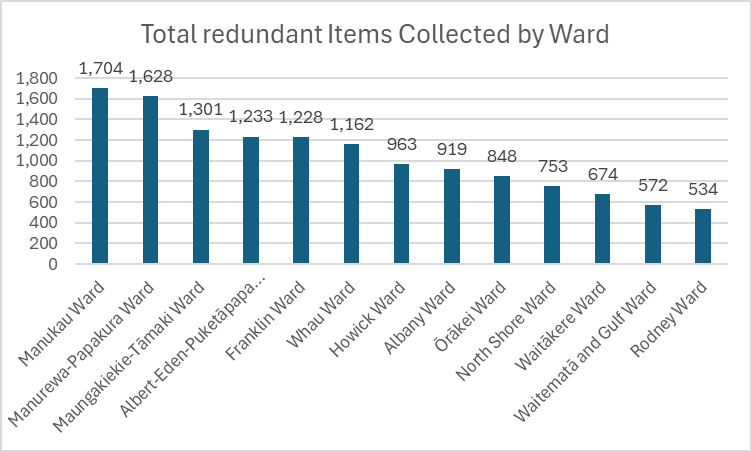 Figure 1: Redundant items collected by Ward
 Figure 2: Exceptions (locations where gear was not picked up) by ward
 How did we do this quarter?
Here’s a summary of TTM site inspection data for the Auckland Transport road network, including both redundant worksites and unprotected risk sites. The data aligns with Road Efficiency Group Te Ringa Maimoa’s (REG) reporting requirements.:
Period |
Total TTM Inspections |
Unnecessary / Redundant Worksites |
Risk Present, No TTM |
Customer Reports / Complaints |
2024 Q4 (Jan–Dec) |
1,929 |
38 |
64 |
2,460 |
2025 Q1 (Jan–Mar) |
440 |
15 |
23 |
592 |
2025 Q2 (Apr–Jun) |
462 |
23 |
20 |
269 |
2025 Q3 (Jul–Aug) |
691 |
24 |
25 |
362 |
Key points:
- There was a noticeable decrease in the percentage of redundant sites this quarter compared to the previous quarter, although it’s similar to the first quarter of the year.
- Addressing both redundant and unprotected sites helps us reduce unnecessary costs, improve safety, and respond to community concerns.
Who was involved? – Redundant Worksites Q3 2025
These tables show which organizations were linked to redundant worksites during Q3 2025. This information helps us identify where improvements can be made and encourages everyone to keep raising the bar for efficient, safe road management.
By Client / Principal
Client / Principal |
Number of Redundant Worksites |
Auckland Transport |
6 |
Watercare Services Ltd |
2 |
Vector |
2 |
Private |
2 |
Unknown |
5 |
Other |
4 |
By Lead Contractor
Lead Contractor |
Number of Redundant Worksites |
Fulton Hogan Ltd |
4 |
Downer Ltd |
2 |
Other |
4 |
Unknown |
6 |
What’s next?
Auckland Transport is committed to making our roads safer, more efficient, and better for everyone. Here’s what’s on the horizon:
-
Reducing unnecessary costs: By identifying and removing redundant worksites, we can save resources and focus efforts where they’re truly needed.
-
Improving safety outcomes: Ensuring that TTM is only used where there’s genuine risk helps protect both road users and workers.
-
Responding to community concerns: We’re listening to feedback from the public and stakeholders and using it to guide improvements.
-
Supporting national TTM improvement goals: Our work aligns with broader industry efforts to raise standards and share best practices.
-
Ongoing monitoring and collaboration: We’ll keep tracking trends, working closely with contractors, and refining our processes to make sure TTM is always effective and justified.
-
Encouraging proactive reporting: We invite everyone—contractors, staff, and the public—to report unnecessary or missing TTM so we can address issues quickly.
Together, these steps will help us build a safer, more efficient road network for all. If you have ideas or want to get involved in these improvements, we’d love to hear from you